AI is driving change – this blog looks at how AI generated Vega/Vega-lite may impact Power BI development.
Introducing Vega/Vega-lite
Vega and Vega-lite (a simplified version of Vega) are visualization grammars – JSON schemas for specifying how data should be presented visually. Vega/Vega-lite allows almost any visualisation to be specified. Power BI currently supports a large and growing number of visualizations – but is it really necessary to have some many? Is it possible to have one visuallization that can be customised to do whatever is needed?
Power BI desktop currently has the most useful visualizations pre-installed

If the pre-installed visualizations don’t provide the necessary functionality, there are also a large number of third-party visualizations that can be imported.

Each of these visualizations can be customised. The customization supported differs between visualizations, and while the customization support is often extensive, the customization has limits. Three examples from different visualizations are shown below.

Are all these visualizations necessary? Is it possible to have one, generic, visualization that can be customized using Vega/Vega-lite to meet most requirements? Deneb does exactly this.

Customising Vega/Vega-lite
Deneb is a visualization that uses Vega/Vega-lite and can be customised to produce any visual graph. Unfortunately, unlike other Power BI visualisations, Vega/Vega-lite is not configured by setting values in data-entry form. It requires JSON that is either pre-written and imported, or written in Deneb’s own editor. Learning how to write Vega/Vega-lite JSON is a steep curve, and this is currently a reason why Deneb is not often used.
There are several ways round this.
Many Vega/Vegalite experts have shared their JSON configurations online, and this provides inspiration of new visualisations and a good starting point for further customisation. Some sites worth visiting are
https://vega.github.io/vega-lite/examples/
https://vega.github.io/vega-lite-v3/examples/
https://vega.github.io/vega/examples/
https://kerrykolosko.com/portfolio/
https://vis.csail.mit.edu/pubs/animated-vega-lite/
https://github.com/PBI-David/Deneb-Showcase/blob/main/README.md
https://deneb-viz.github.io/community/resources
https://data-vogue.com/
https://github.com/shadfrigui/vega-lite
https://github.com/PBIQueryous/Deneb
The Vega/Vega-lite JSON can be extracted from any of these examples, copied into a new Deneb visual, and modified to work in the new environment. This can work, but even modifying existing JSON is not always easy.
Deneb supports templates, which does make it a little easier.

Scrolling down on the left allows a template to be imported. After the template is imported scrolling down on the right allows the fields in the template to be mapped to the Power BI fields on the visual.

Once the template has been imported and the fields mapped, the create button can be clicked.
There are a large number of free templates. Two good sources are https://thysvdw.github.io/templates/ and https://github.com/PowerBI-tips/Deneb-Templates
Using templates is easier than just doing a cut-and-paste from an existing Vega / Vega-lite visual but customising it can still be difficult. This is where AI is revolutionary.
Let us look at the example here https://vega.github.io/vega-lite/examples/bar.html. This is not in a Power BI report, but the same approach can be used with the Vega/vegalite JSON found in one of the many sample Power BI reports with Deneb visualisations available on the web.
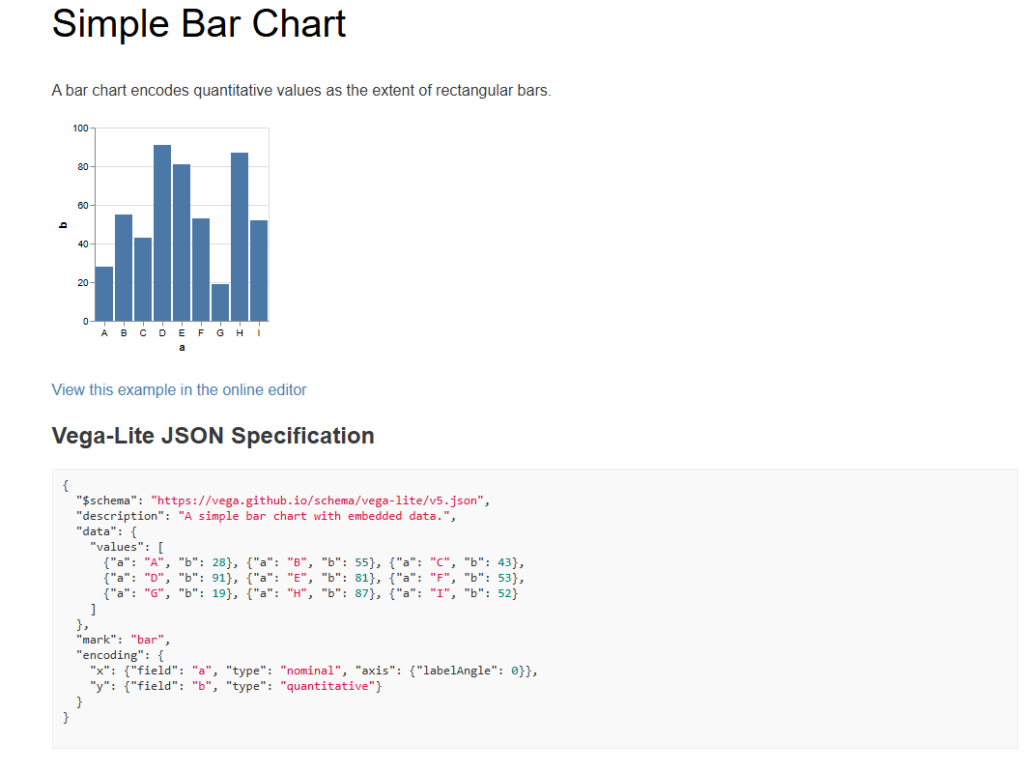
Opening the online editor gives this
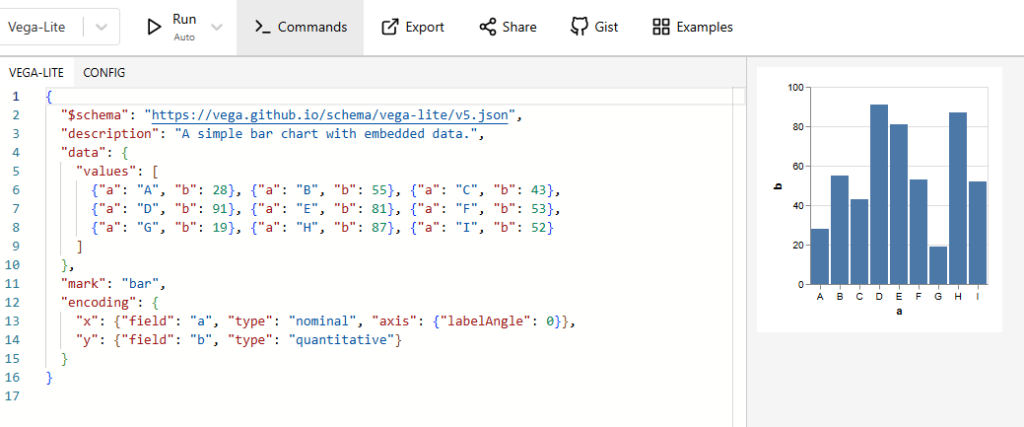
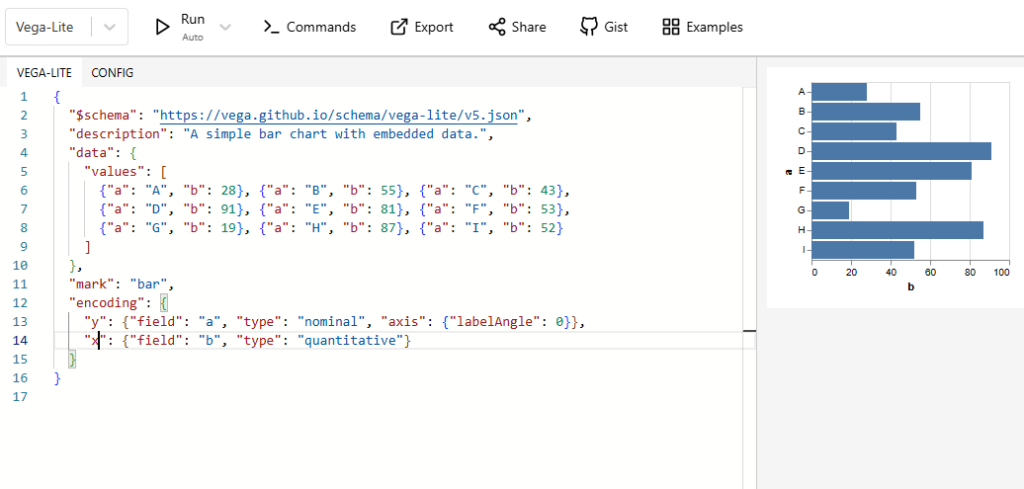
Converting this into a horizontal bar chart is straightforward – simply switch the x and y axes.
Adding a running total is more difficult, and this is where AI helps. Let’s ask ChatGPT.
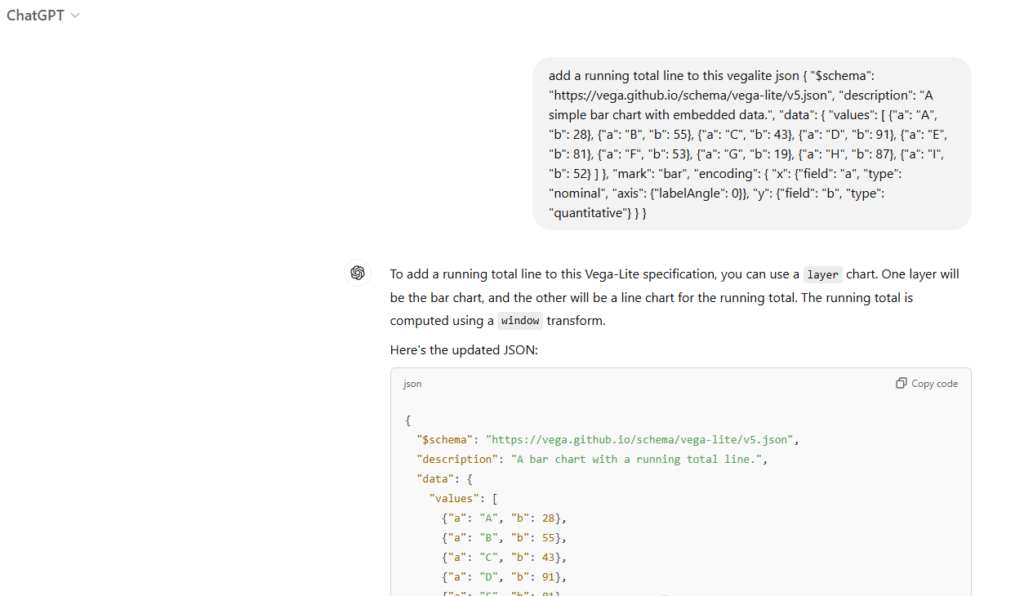
When the code is copied and pasted into the online editor we see
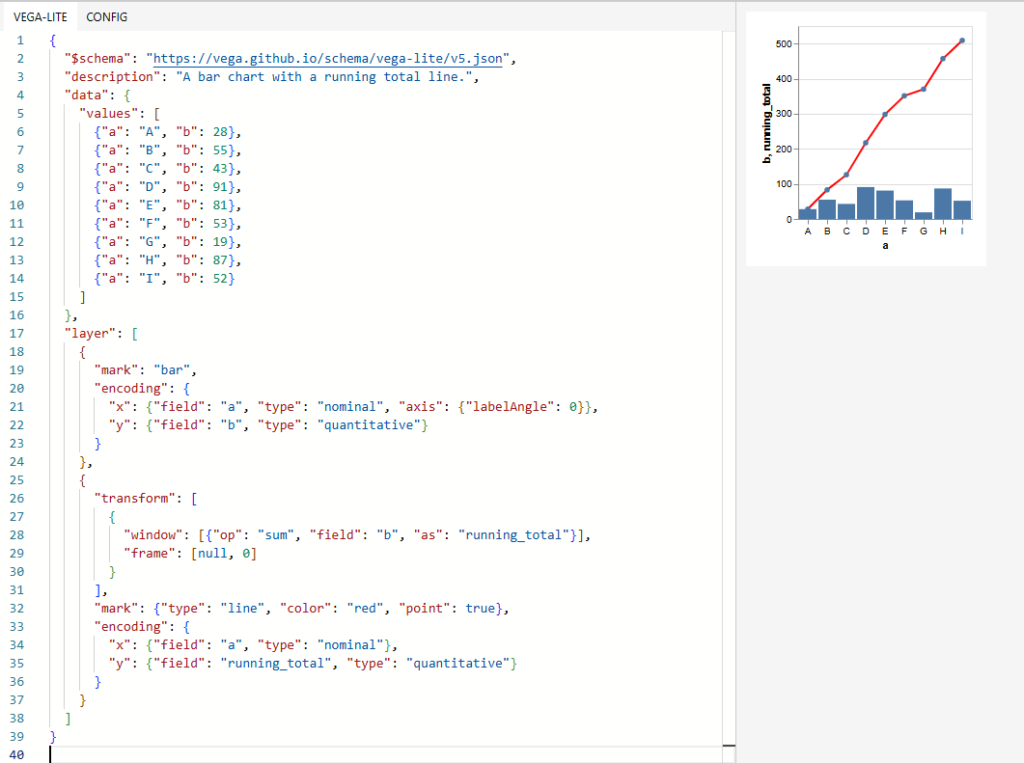
This may not be exactly what is required, but ChatGPT can be consulted again until the required result is reached. The current generation of AI tools is not perfect – AI does not always generate the correct code, and sometimes the code generated by AI does not run at all. The same exercise on Copilot produces:

Copying this code and pasting it into the editor gives:
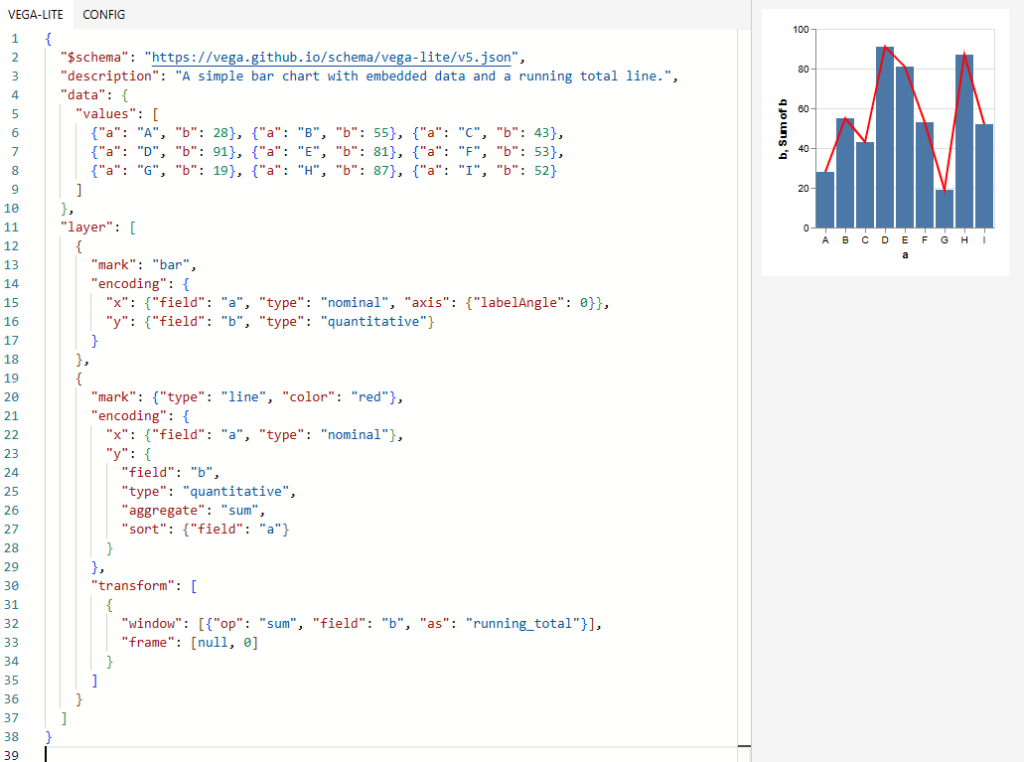
This is close but not correct. The line is plotting the value of "b", when it should be plotting "running_total". A manual correction gives the result we want.
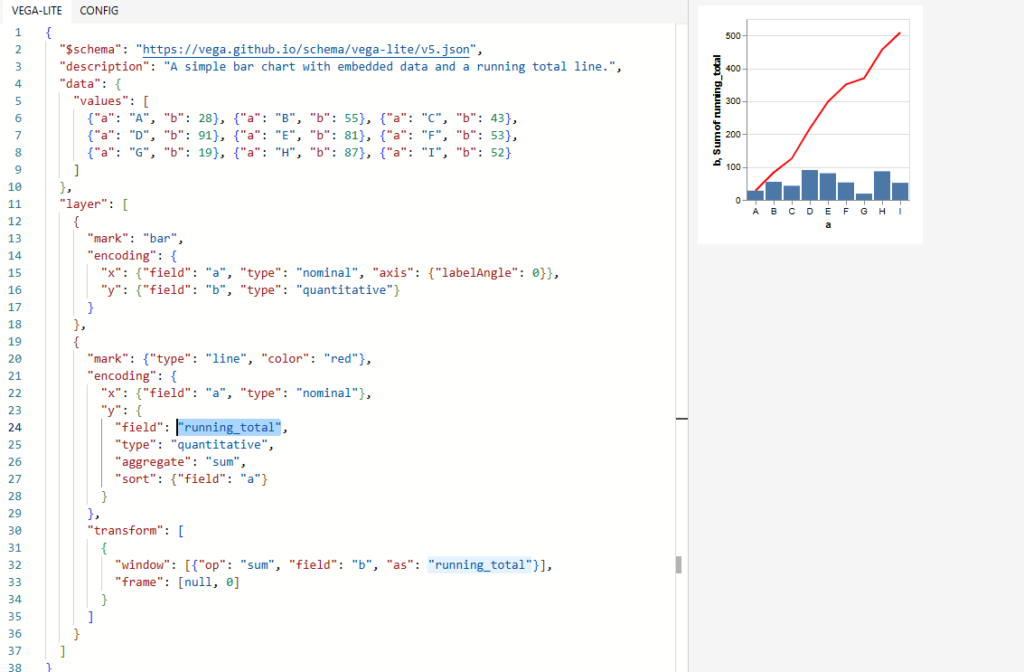
This demonstrated how AI can modify Vegalite JSON to add custom functionality. This is an emerging technology – the AI is not foolproof and does not always produce the correct result.
Attempts are being made to integrate AI more closely. AI can be added to editors like VS Code, and attempts such as https://chat.openai.com/g/g-JxECNXqsw-vicky-vega are being made to integrate AI and Vega.
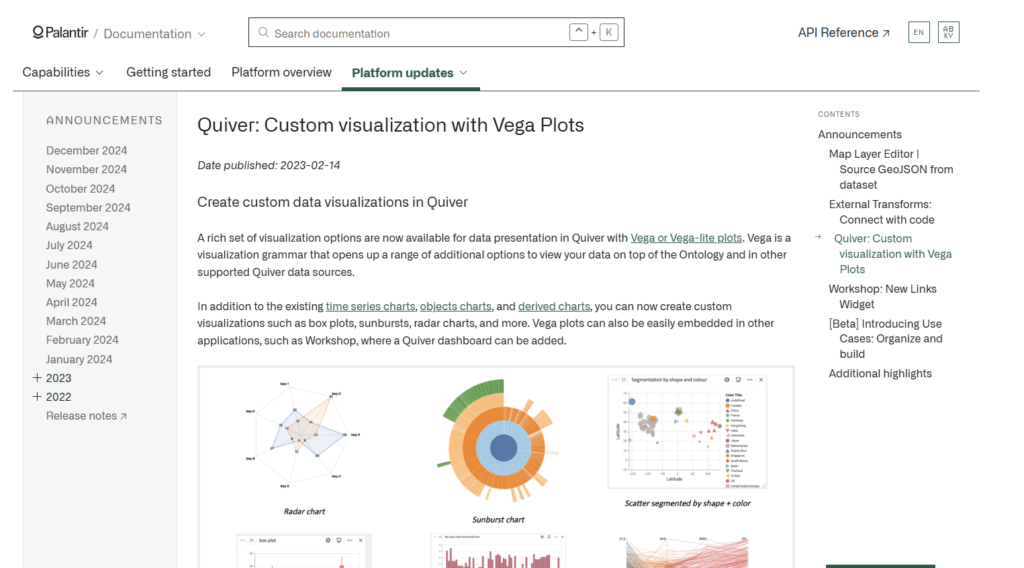
Vega/Vega-lite is becomming more widely supported- the image below shows Vega and Vega-lite support in Palantir’s Quiver.
As AI improves and becomes more integrated it may become the standard approach. Once this occurs the generated Vega/Vega-lite will be hidden from the developer. There will only need to be one visualization, which be configured by typing in natural-language instructions on how it should display itself.
Discover more from MaxPowerBI.PRO
Subscribe to get the latest posts sent to your email.
